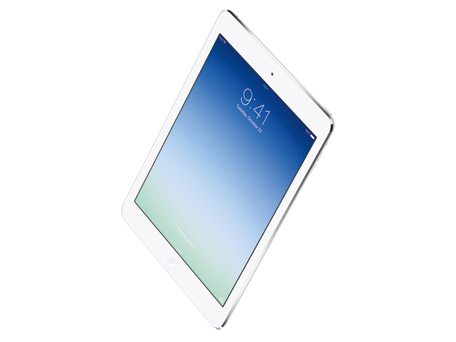
The latest study by J D Power has once again given top place to the Apple iPad, followed in second place by Samsung and then, placed below the study average, are Asus, Amazon and Acer. The J D Power 2014 US Tablet Satisfaction StudySM – Volume 1 has noted that a reduction in overall satisfaction with tablet devices seems to be the result of an overall decline in their price.
J.D. Power and Associates, a US based global marketing information services firm, said “Since the inaugural U.S. Tablet Satisfaction Study in 2012, a number of new tablet OEMs have entered the U.S. marketplace, differentiating themselves to satisfy a growing interest in owning a tablet,” said Kirk Parsons, senior director of telecommunications services at J.D. Power. “Price has significantly impacted the marketplace. The average purchase price continues to drop and consumer expectations of tablet performance and features are different than they were for past products. Subsequently, overall satisfaction has declined, especially with ease of operation, as navigation features and functions have changed.”
Based on a 1,000 point scale of satisfaction the Apple iPad scored an impressive 830 for overall consumer satisfaction, the iPad was ranked best in all areas apart from purchase price. Samsung was given second place with a score of 822 for overall consumer satisfaction, in contrast to the Apple iPad Samsung also won higher than average marks in the purchase price factor, Samsung also scored higher than average in other areas, such as design and styling and features. The study average was given a score of 821 and rated below that score are Asus with 820 points, Amazon with 817 points and Acer with 769 points.
J D Power noted these key findings:
“Lower price is the No.1 reason for tablet choice in 2014, with 25 percent of current tablet owners citing price as the main reason for selecting their current brand, compared with 21 percent in 2013. Features offered and brand reputation are the next most-frequently cited reasons for selecting a tablet device (22% and 21%, respectively).
Since 2012, the average purchase price of a tablet has decreased by $53 ($337 in 2014 vs. $390 in 2012).
Overall satisfaction has decreased by 18 points to 835 on a 1,000-point scale in 2014 from 853 in 2012. The largest decline in satisfaction is in the ease of operation factor, with substantial decreases in two attributes over the three-year time frame: navigation (8.30 vs. 8.52, respectively, on a 10-point scale) and adjusting tablet settings (8.30 vs. 8.50, respectively).
It’s taking longer for tablet owners to perform the initial set-up on their devices in 2014 than three years ago, as more features and pre-loaded apps are included with the device. In 2014, the average time for initial tablet set-up is 64 minutes, compared with 55 minutes in 2012.
Prior to purchasing a tablet, 50 percent of consumers rely on brand reputation to help drive their brand purchase decision—an increase from 42 percent just six months ago. Manufacturer websites (47%) and recommendations from friends, family members or colleagues (46%) are key drivers of brand purchase choice.”
The J D Power 2014 US Tablet Satisfaction Study – Volume 1 was based on the experiences of 2,513 consumers who have owned their tablets for less than a year. The study was made between September 2013 and February 2014 and measured satisfaction across five areas in varying degrees – performance, ease of operation, features, styling and design and cost.
http://www.jdpower.com/press-releases/2014-us-tablet-satisfaction-studysm%E2%80%94volume-1

